
A few days ago, I posted about topographic maps, including a discussion of how a small army of small surveyors made one of my local park. At Heard Island, surveying isn’t a walk in the park.
Many maps have been made of Heard Island, showing the topography and general geographic features of the island, and sometimes including the locations of major macrofauna (penguins, elephant seals, etc.).[1] An excerpt I made from one produced in 1985 is shown above. Although there are more recent maps available, including maps with higher topographic resolution, this one is more visually illustrative of the landforms.
Maps of Heard Island are difficult to produce, in part because there is a dearth of high-resolution, high-quality data. In most parts of the developed world, detailed topographic maps are made not through boots-on-the-ground surveying but by airborne LiDAR. For instance, aerial imagery and LiDAR provided very useful data for understanding the Oso landslide in Washington state. However, aerial flights over Heard Island are much less frequent, and mapping efforts there come without the obvious benefits to the local populace.
Surveying the whole island by foot at high detail is untenable, because the area is quite large, the terrain difficult, and the weather inclement, even in the summer. However, portions have been mapped by hand (and theodolite).
But perhaps the biggest challenge Heard Island presents to cartographers is the rapidity of its changes. Volcanic eruptions can add new land to the island, or make parts higher. Glaciers can carve out the rocks and leave them as till, sometimes in the ocean, sometimes in the lagoons, and sometimes as moraines on the land. Not only can the glaciers carve out the rocks, but as less snow accumulates on the glaciers than is lost to melting, the glaciers will retreat. This opens up new land which before had been covered in ice. Stephenson Glacier, on the southeast corner of Heard Island, has retreated significantly in the last 60-70 years, revealing a great deal of new terrain.
Steep slopes and the very wet environment (lots of snow and rain) lead to very high rates of erosion. Outwash channels from the glaciers can carve into the rock and transport sediment into lagoons and near-shore areas.
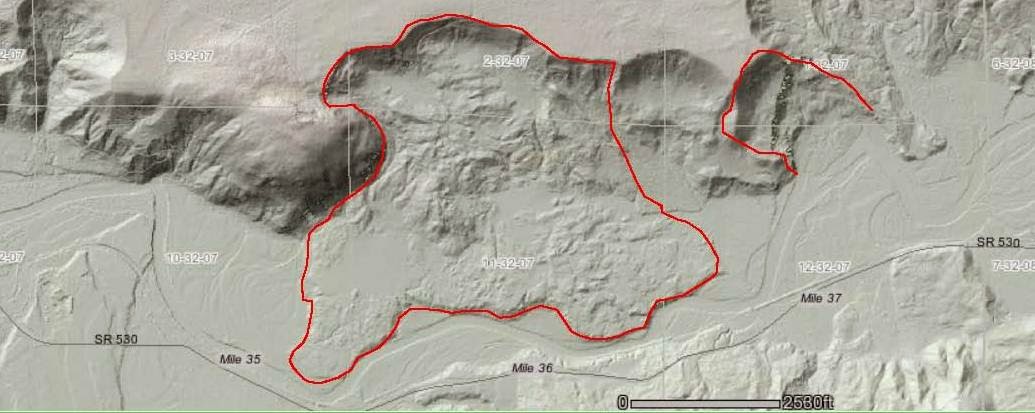
Finally, there’s another agent of change: landslides. Take a look at the LiDAR image above, showing the landslide region. Now take a look at the southwest portion of the Heard Island shown at the top of the post. The curving crest along the north and east sides of the volcano, as well as the ridge extending to the south-southwest are interpreted to be the boundary (technical term: scarp) of a debris avalanche (a landslide-like process).[2]
Taken as a whole, these processes change the landscape significantly on a decade-to-century timescale, if not even more rapidly. This is why making maps and keeping them current is so valuable: it give us a way to see how the landscape is changing over time. Perhaps the upcoming Heard Island Expedition will do some mapping and be able to provide updates which reflect the latest changes at Heard Island.
[1] https://www1.data.antarctica.gov.au/aadc/mapcat/list_view.cfm?list_id=1, accessed Feb. 6, 2015. Free registration required for map download.
[2] Quilty, P. G. & Wheller, G. 2000; Heard Island and The McDonald Islands: a Window into the Kerguelen Plateau. Papers and Proceedings of the Royal Society of Tasmania. 133 (2), 1–12.
